Why Supplier Scorecards Are Non-Negotiable in Modern Manufacturing
Manufacturing procurement teams face a persistent challenge: they work with dozens — sometimes hundreds — of suppliers, yet most of their performance data lives in inboxes, spreadsheets, and the institutional memory of individual buyers. When a critical order is delayed or a batch fails inspection, the root cause is often not a one-time failure but a pattern that was never systematically tracked. A supplier scorecard changes that. It converts subjective impressions into objective, comparable data — and gives procurement leaders the evidence they need to make confident sourcing decisions.
The global supplier evaluation software market reflects this urgency. Valued at approximately $674 million in 2024, it is projected to exceed $1 billion by 2031, driven by manufacturers recognising that informal supplier management is no longer viable in a world of compressed lead times and complex global supply chains.
This guide explains how to design, implement, and operationalise a supplier scorecard that works for mid-market manufacturing companies — including the five evaluation dimensions that matter most, how to weight them, and how digital sourcing platforms are automating the entire process.
What Is a Supplier Scorecard?
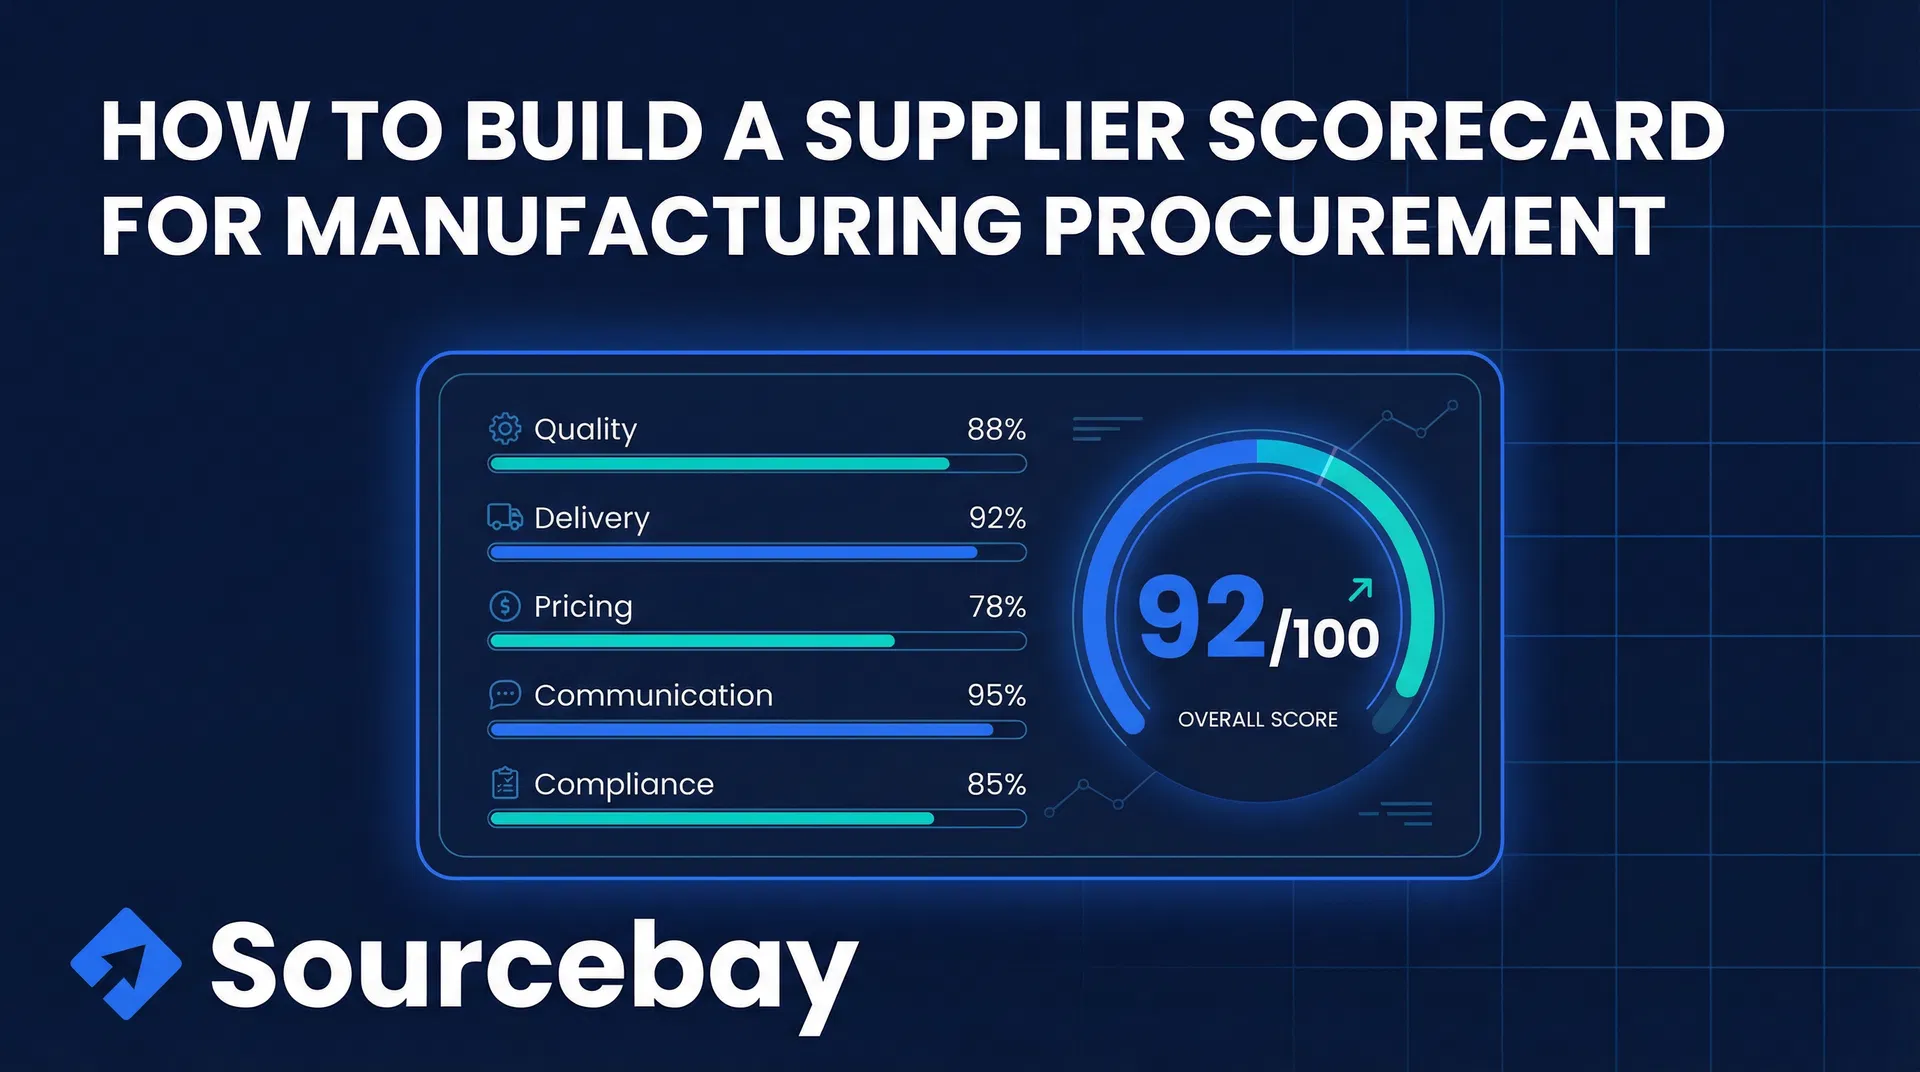
A supplier scorecard is a structured framework for measuring and comparing supplier performance across a defined set of criteria. It assigns numerical scores — typically on a 1–100 or 1–5 scale — to each dimension, applies weights based on business priorities, and produces a composite score that can be tracked over time and benchmarked across your supplier base.
The output is not just a number. A well-designed scorecard creates a shared language between your procurement team and your suppliers. When a supplier sees their on-time delivery rate drop from 94% to 87% over two quarters, that data opens a productive conversation that a vague complaint never could.
The Five Core Dimensions of a Manufacturing Supplier Scorecard
1. Quality Performance
Quality is consistently ranked as the most important supplier evaluation criterion by procurement professionals. For manufacturing, this means tracking:
- Incoming inspection pass rate — the percentage of received goods that pass first-pass quality inspection without rework or rejection
- Parts per million (PPM) defect rate — the number of defective units per million delivered, a standard metric in automotive and aerospace supply chains
- Corrective action response time — how quickly a supplier acknowledges a quality issue and submits a corrective action report (CAR)
- Warranty claim rate — the proportion of delivered goods that generate downstream warranty claims
A world-class incoming inspection pass rate is typically 98.5% or above. Suppliers consistently below 95% should be placed on a formal improvement plan, with a defined timeline for remediation.
2. Delivery and Lead Time Reliability
On-time delivery (OTD) is the second pillar of supplier performance. Late deliveries cascade through a manufacturing operation — they delay assembly, disrupt production schedules, and ultimately affect customer commitments. Key metrics include:
- On-time delivery rate — the percentage of purchase order line items delivered on or before the confirmed delivery date
- Lead time accuracy — how closely actual lead times match quoted lead times at the time of order
- Order fill rate — the percentage of ordered quantity delivered in a single shipment (partial shipments increase handling costs and administrative burden)
Industry benchmarks vary by category, but a reasonable target for a strategic manufacturing supplier is an OTD rate of 95% or above. Suppliers below 90% on a consistent basis represent a material supply risk.
3. Commercial and Pricing Performance
Cost is not just the unit price on the purchase order. A comprehensive commercial scorecard dimension captures:
- Price competitiveness — how the supplier's pricing compares to market benchmarks and alternative quotes for equivalent specifications
- Cost reduction contribution — whether the supplier proactively proposes cost-down initiatives, value engineering suggestions, or volume-based pricing improvements over time
- Invoice accuracy — the percentage of invoices that match the purchase order without discrepancies, which directly affects accounts payable efficiency
- Payment term compliance — adherence to agreed payment terms and absence of unilateral changes
Procurement teams that track cost reduction contributions from suppliers typically find that strategic suppliers who are actively engaged in cost improvement deliver 3–8% annual savings on managed spend categories.
4. Responsiveness and Communication
This dimension is often underweighted, but it is a leading indicator of how a supplier will perform under pressure. Metrics to track include:
- RFQ response time — how quickly the supplier returns a quote after receiving a request for quotation
- Technical query response time — turnaround time on engineering or specification questions
- Issue escalation responsiveness — how promptly the supplier engages when a problem is raised
- Forecast acknowledgement rate — the proportion of rolling forecasts formally acknowledged by the supplier
A supplier who responds to RFQs within 24 hours and acknowledges purchase orders within 4 hours is operationally easier to work with than one who takes a week — even if their unit prices are similar. Responsiveness is a proxy for organisational discipline.
5. Compliance and Risk Profile
The fifth dimension has grown significantly in importance since 2020. It covers:
- Certification status — whether the supplier holds and maintains relevant quality certifications (ISO 9001, IATF 16949, AS9100, ISO 13485) and whether those certifications are current
- Financial stability — indicators of financial health, including payment behaviour with their own suppliers and any publicly available credit risk signals
- Regulatory compliance — adherence to applicable regulations, including RoHS, REACH, conflict minerals (CMRT), and export control requirements
- Sustainability and ESG — increasingly, buyers are tracking carbon footprint, labour practices, and supply chain transparency as part of their supplier risk assessment
How to Weight Your Scorecard
The right weighting depends on your industry, product criticality, and business priorities. The table below provides a starting framework for a mid-market precision manufacturing company:
| Dimension | Weight | Rationale |
|---|---|---|
| Quality Performance | 35% | Defects have direct cost and reputational consequences |
| Delivery Reliability | 25% | Late deliveries disrupt production schedules |
| Commercial Performance | 20% | Total cost of ownership, not just unit price |
| Responsiveness | 10% | Operational efficiency and relationship health |
| Compliance & Risk | 10% | Regulatory and supply continuity risk |
These weights should be reviewed annually and adjusted as your business priorities evolve. A company entering a highly regulated market (medical devices, aerospace) would typically increase the compliance weighting to 20–25% and reduce the commercial weighting accordingly.
Scoring and Segmentation: Turning Data into Decisions
Once you have scores, you need a segmentation framework that tells you what to do with them. A four-tier model works well for most manufacturing organisations:
Strategic Partners (Score: 85–100): These suppliers consistently exceed expectations across all dimensions. Invest in deeper collaboration — joint product development, capacity reservation agreements, and preferred supplier status. Share your 12–18 month demand forecasts with them.
Approved Suppliers (Score: 70–84): Solid performers who meet your requirements reliably. Maintain the relationship, conduct annual business reviews, and identify one or two specific improvement areas to work on together.
Suppliers Under Development (Score: 55–69): These suppliers have meaningful gaps in at least one dimension. Issue a formal improvement plan with 90-day milestones. If performance does not improve within two review cycles, begin qualifying an alternative source.
At-Risk Suppliers (Score: Below 55): Immediate action required. Dual-source the category, increase incoming inspection frequency, and initiate a formal corrective action process. Do not award new business until performance improves.
Common Mistakes to Avoid
Measuring too many metrics at once. A scorecard with 30 KPIs is not more rigorous — it is less actionable. Start with 8–12 metrics across the five dimensions and add complexity only when you have the data infrastructure to support it.
Scoring without sharing. A scorecard that lives only in your procurement system is a missed opportunity. Sharing scores with suppliers — ideally in a quarterly business review — transforms the scorecard from an internal audit tool into a collaborative improvement mechanism.
Using lagging indicators only. On-time delivery and defect rates are important, but they tell you what already happened. Add at least one or two leading indicators — such as supplier capacity utilisation or open corrective action count — to give you earlier warning of emerging problems.
Ignoring the cost of data collection. If your team spends 10 hours per month manually pulling data from ERP systems, email threads, and spreadsheets to populate a scorecard, the administrative burden will eventually cause the programme to collapse. Automate data collection wherever possible.
How Digital Sourcing Platforms Automate Supplier Scorecards
The manual scorecard process — exporting data from ERP, consolidating it in Excel, calculating weighted scores, and distributing reports — is time-consuming and error-prone. Modern B2B sourcing platforms are changing this by centralising supplier interaction data and generating performance metrics automatically.
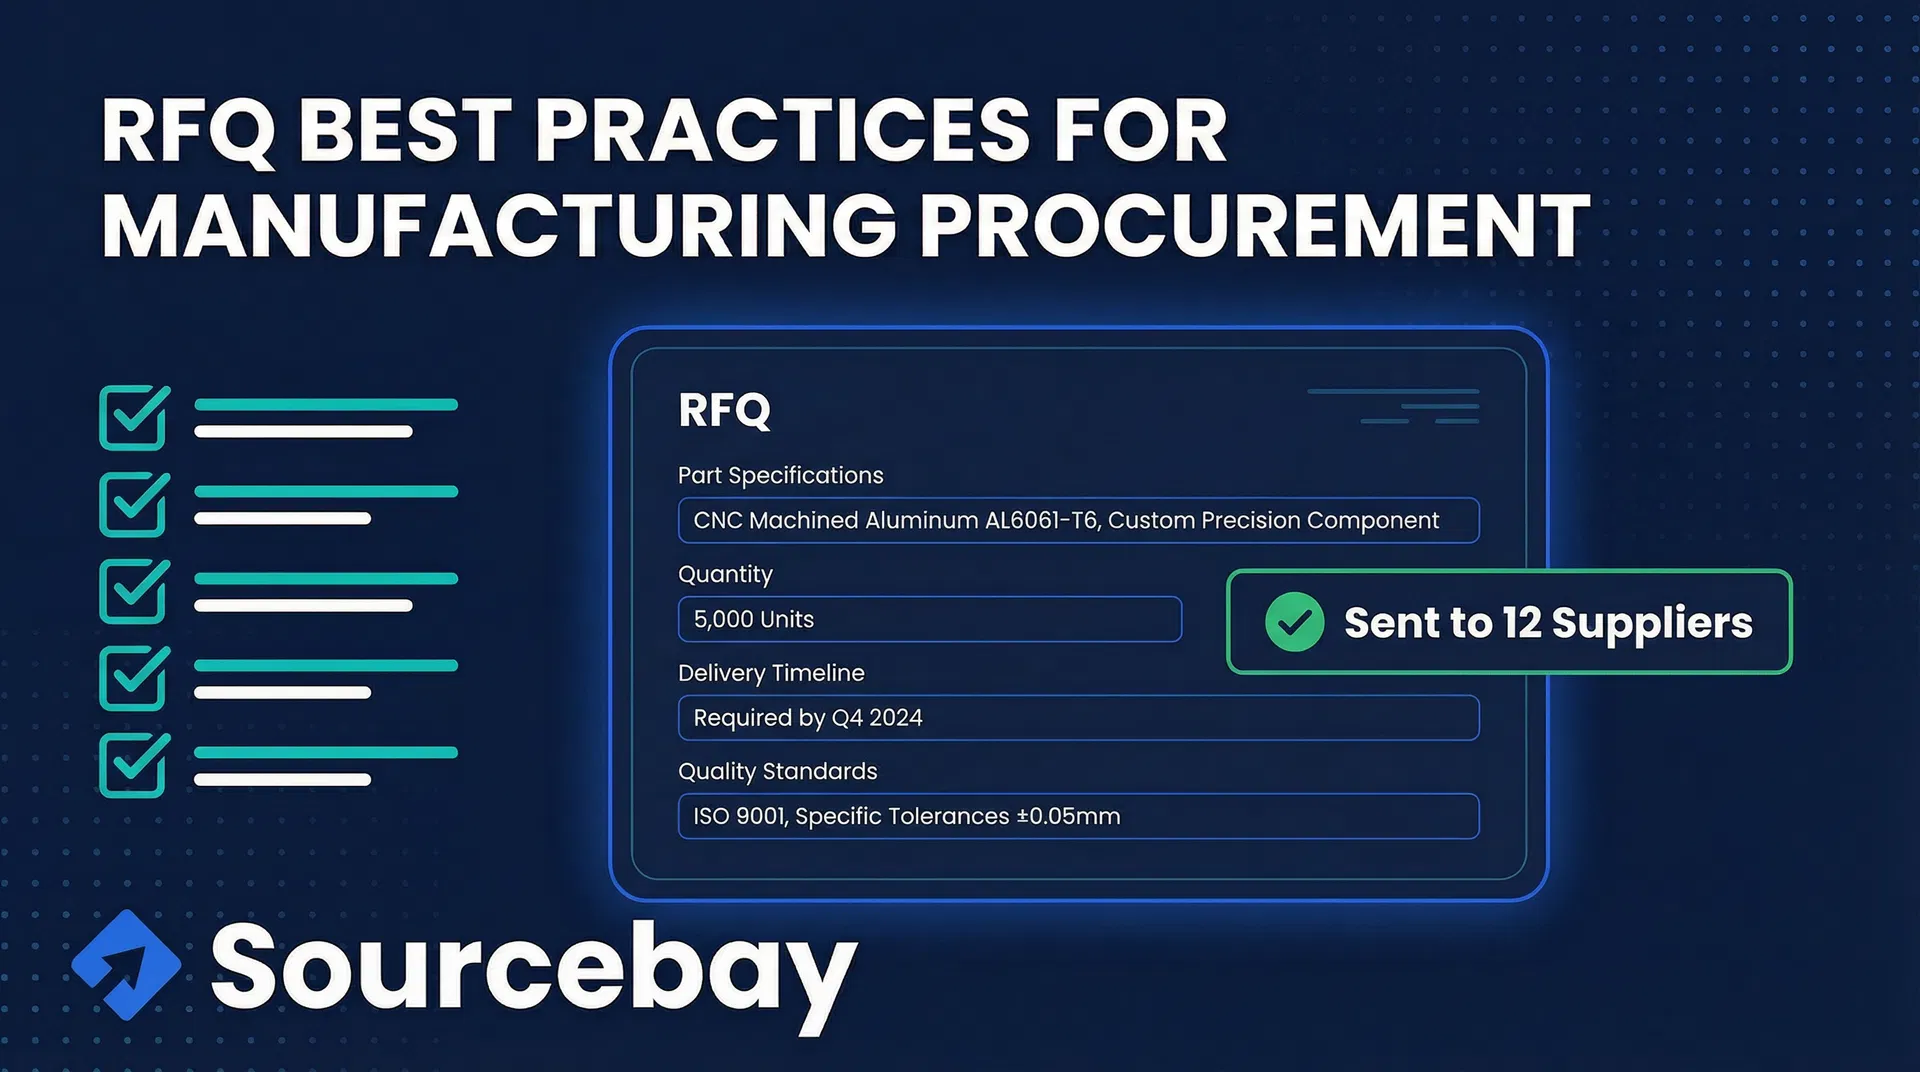
When RFQs are issued, tracked, and responded to through a single platform, the system captures response times, quote accuracy, and order fulfilment data without any manual data entry. Quality data from incoming inspections can be logged against specific purchase orders. Certification documents are stored centrally and flagged when they approach expiry.
The result is a supplier scorecard that updates in near real-time, rather than one that is produced quarterly with a significant lag. Procurement managers can see a supplier's trailing 90-day performance at a glance, identify deteriorating trends before they become crises, and have data-backed conversations with suppliers about specific incidents rather than general impressions.
For mid-market manufacturers who lack the resources to implement enterprise-grade supplier relationship management (SRM) software, a purpose-built sourcing platform that integrates RFQ management with supplier performance tracking offers a practical and cost-effective path to structured supplier evaluation.
Getting Started: A Practical Implementation Roadmap
Month 1 — Define and align. Select 8–10 metrics across the five dimensions. Agree on weights with your procurement leadership and key internal stakeholders (quality, operations, finance). Document the data sources for each metric.
Month 2 — Baseline your supplier base. Calculate scores for your top 20 suppliers using historical data. This baseline will reveal which suppliers are genuinely performing well and which have been benefiting from low scrutiny.
Month 3 — Communicate to suppliers. Share the scorecard framework with your suppliers before you share their scores. Give them the opportunity to understand the methodology and flag any data discrepancies.
Month 4 onwards — Operate quarterly review cycles. Conduct formal quarterly business reviews with your top 10–15 suppliers, using the scorecard as the agenda framework. Track score trends over time, not just point-in-time snapshots.
A supplier scorecard is not a one-time project. It is an ongoing management discipline that, when embedded into your procurement operating rhythm, becomes one of the most powerful tools available for reducing supply chain risk and improving total cost of ownership.
Manufacturing Procurement Specialists
The Sourcebay Editorial Team comprises seasoned professionals with 15+ years of combined experience in B2B manufacturing procurement, supply chain management, and industrial sourcing across automotive, aerospace, electronics, and precision engineering sectors. Our team has helped hundreds of procurement managers streamline RFQ workflows, qualify suppliers, and reduce sourcing cycle times. We write to share practical, field-tested insights for engineering and procurement professionals.